How To Analyse Survey Result With Excel Spreadsheet (excel & Spss)
Exporting survey results into Excel makes analyzing the data easier by using Excel's tools to sort, explore, and understand the information. It helps spot trends and insights quickly and using simple calculations and tables makes the analysis deeper.
Now let us see how you can do this on the enquete platform.
Note: You must publish the survey to start registering results from respondents.
Step 1: Download Excel Spreadsheet
-
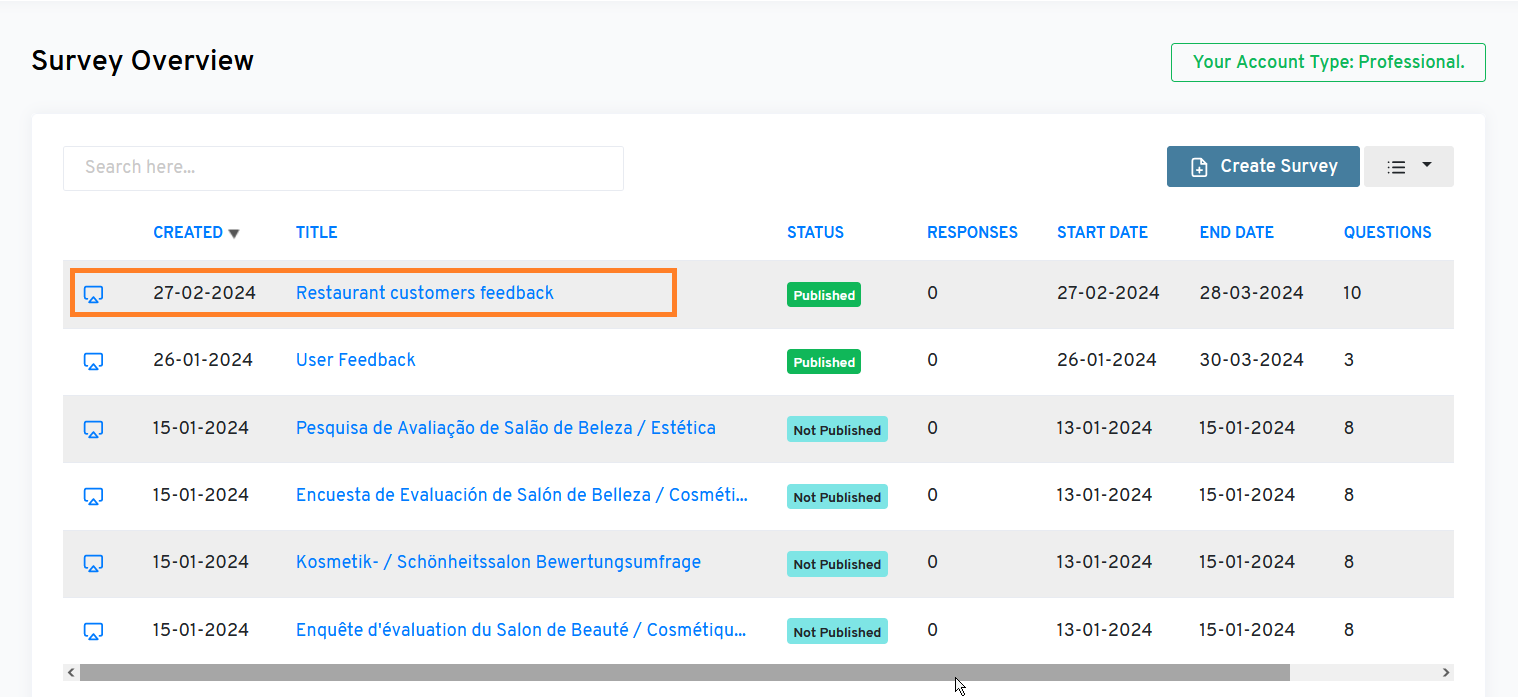
Login to your enquete account
-
Click on the title of the survey you wish to export
-
Hover your mouse over the menu item “Export”
-
Click on the “Excel” option to download the file
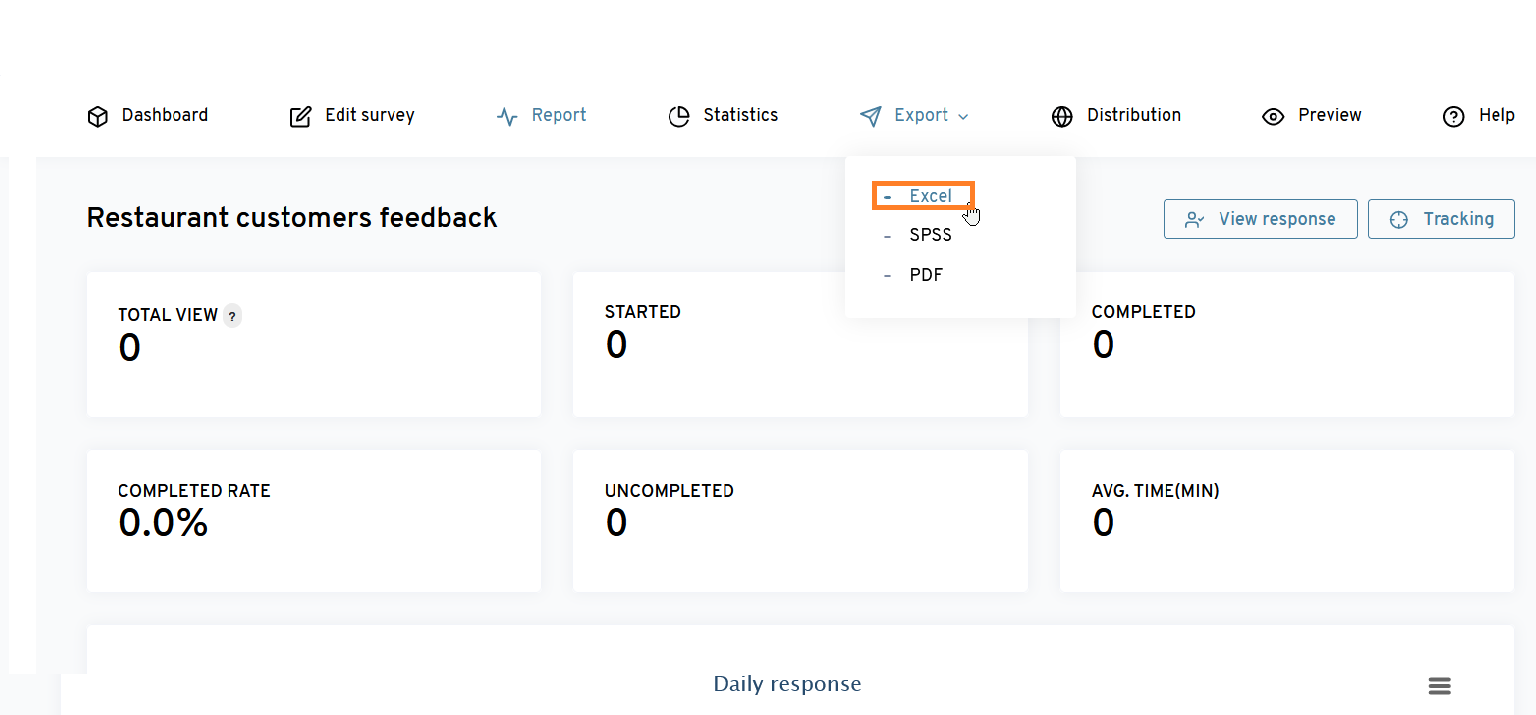
This will download an Excel spreadsheet containing all the respondent's feedback directly to your computer
Step 2: How to Use Excel Export
Your downloaded Excel spreadsheet contains survey results structured across different sheets, each serving a specific purpose. Here's a breakdown of each sheet and how it can be used for analysis
Percentage View
This shows the rate at which respondents respond to each question. It reveals the percentage of the audience that selects a particular answer. At a glance, you can see which answers have the highest picks.
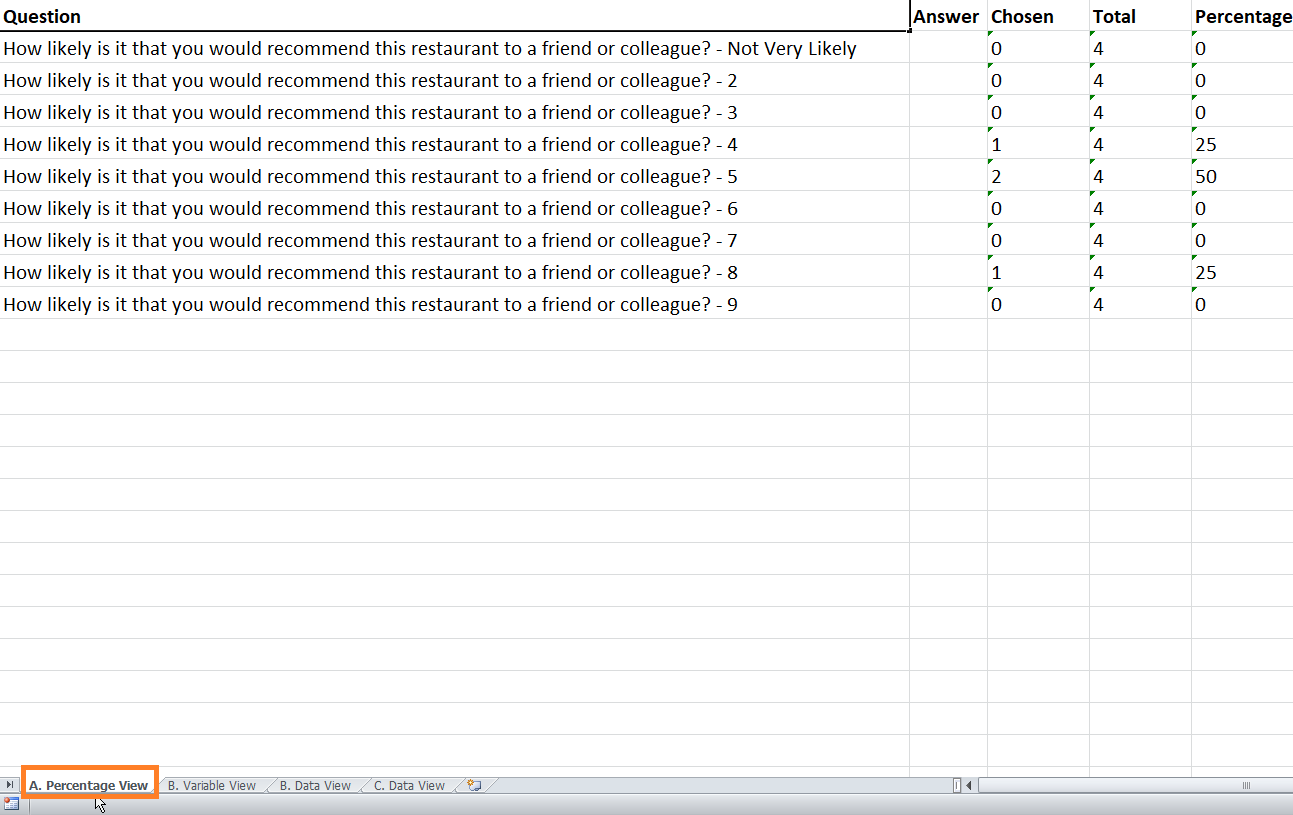
How to use it for analysis:
- Identify trends or patterns in respondent answers.
- Assess the overall satisfaction or preference towards the topics surveyed.
- Easily visualize data by creating charts or graphs based on the percentage distribution of responses.
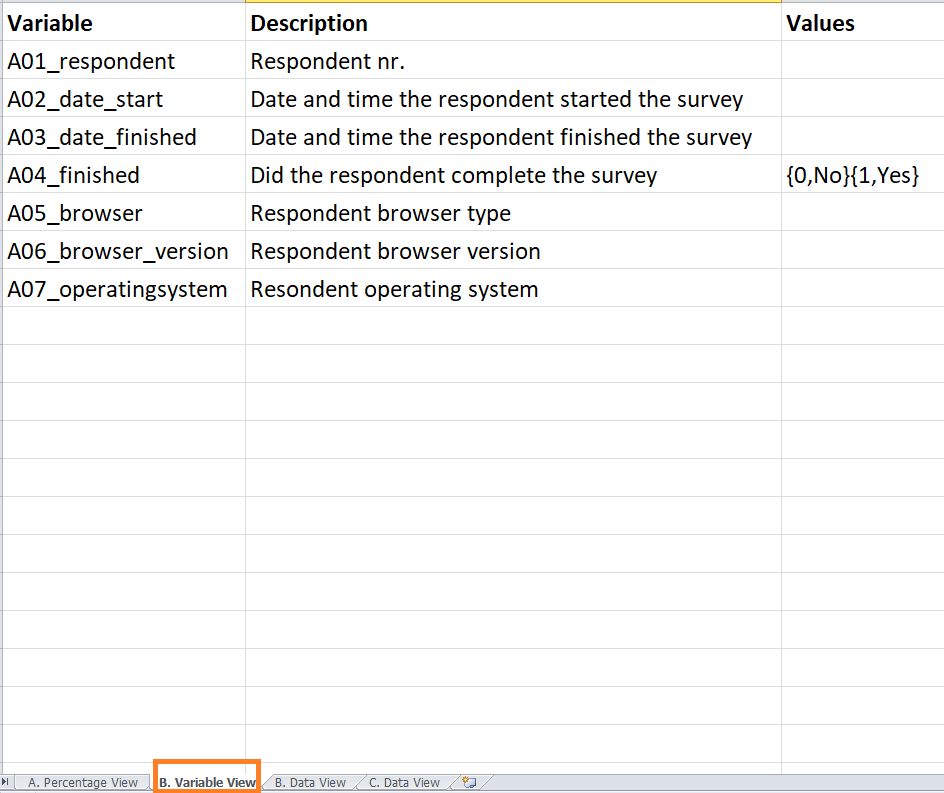
B. Variable View
This sheet explains certain variables with which each responder can be classified and how they will be interpreted for analysis.
This is essential for understanding what each question or data point represents in the dataset, especially if the survey includes a wide range of questions.
How to use it for analysis:
- Familiarize yourself with the survey's structure and the type of data collected.
- Use the descriptions to interpret the data accurately during analysis.
- Refer to the "Values" column for questions with predefined answers to understand the coding scheme (e.g., {0,No}{1,Yes} for binary questions).
C. Data View
This sheet displays the answers and information of each respondent allowing for detailed data analysis.
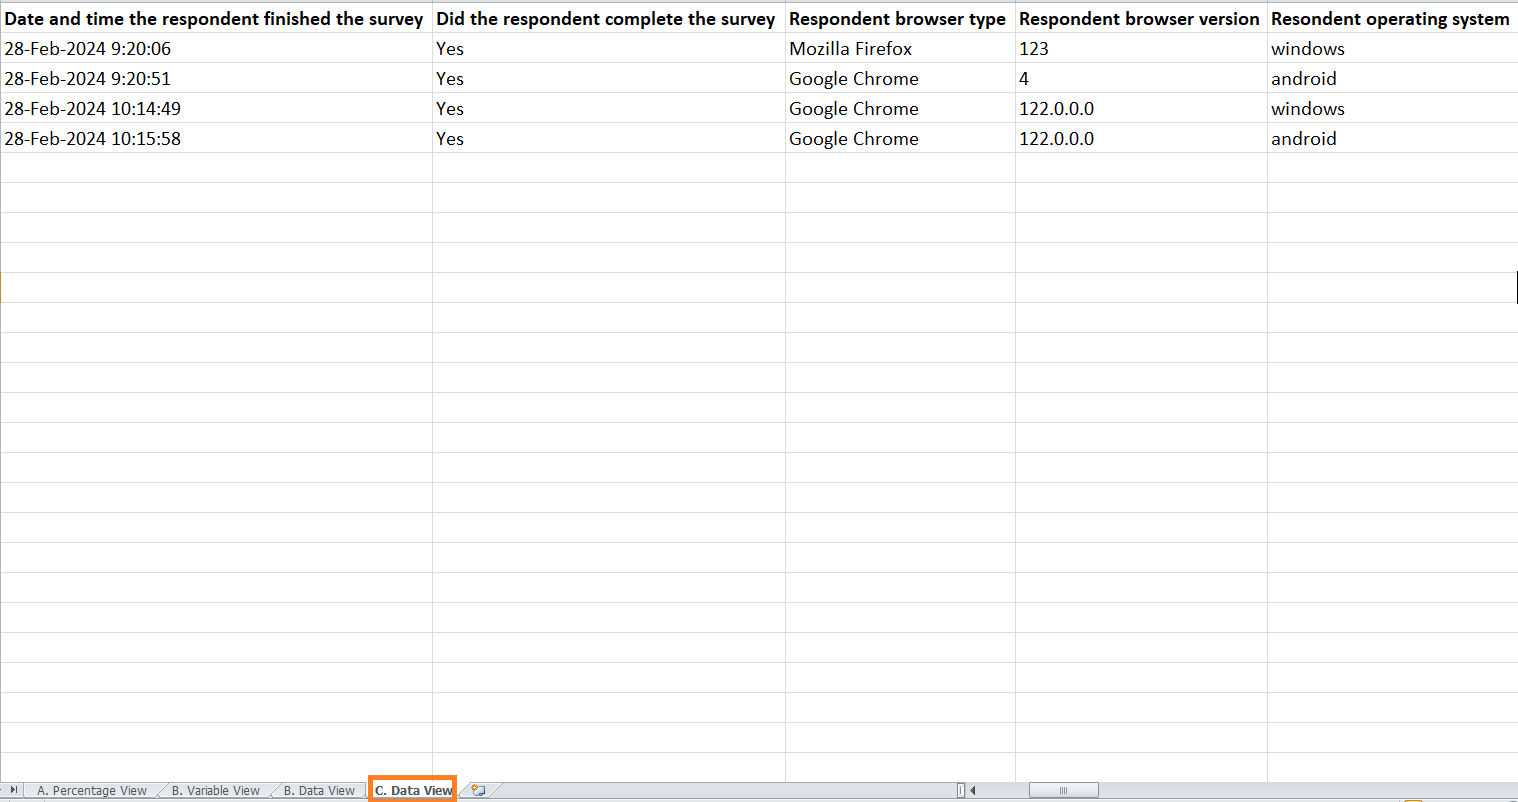
How to use for analysis (assuming data were present):
- Perform statistical analysis on the raw data to uncover deeper insights.
- Filter responses based on specific criteria (e.g., demographics, completion status).
- Cross-tabulate questions to explore relationships between different variables.