Most surveys end with a report.
That's where they shouldn't end.
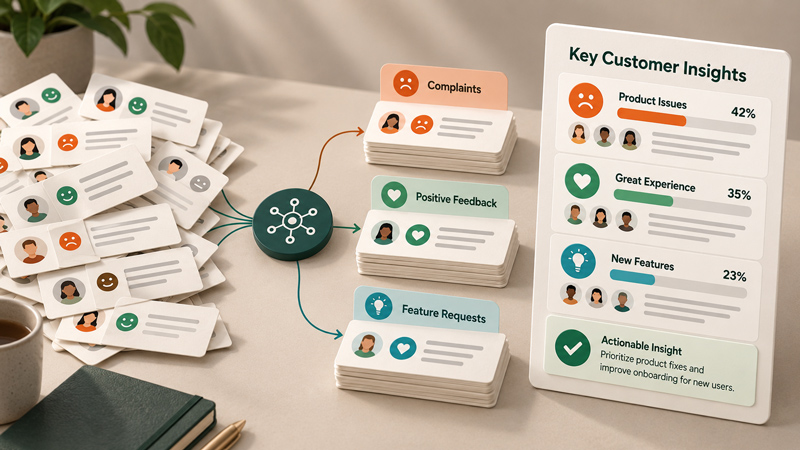
If you've collected meaningful responses from customers, employees, users or a broader audience, you may have something more valuable than a set of answers.
You may have the foundation for an original research report.
From Survey to Research Asset
Imagine your company collects 1,000 responses to this question:
What is the biggest challenge your company faces when collecting customer feedback?
You find:
-
41% say getting enough responses
-
27% say analyzing responses
-
19% say choosing the right questions
-
13% say distributing surveys
That's interesting.
But a research report can go much further.
You can investigate:
-
Differences by company size
-
Differences by industry
-
Differences by role
-
Differences by region
-
Differences between experienced and inexperienced teams
Now you have a dataset.
Start With a Research Question
A strong report begins with a meaningful question.
Examples:
How are businesses using customer feedback in 2027?
What prevents companies from acting on customer feedback?
What do customers expect from AI-powered services?
What makes consumers trust a new brand?
What causes customers to switch providers?
The question should matter to the people you want to reach.
Design the Survey Around the Question
Don't add questions simply because you can.
Every question should help answer the research objective.
A research project might include:
Background
-
Industry
-
Company size
-
Role
-
Region
Behavior
-
How often do you collect feedback?
-
Which channels do you use?
Attitudes
-
How valuable do you consider customer feedback?
Challenges
-
What is the biggest obstacle?
Outcomes
-
How often does feedback influence decisions?
Open-ended
-
What is the biggest improvement you would make?
Now you can analyze the findings across different groups.
Look for Differences
The headline finding may be interesting.
The differences are often more interesting.
Suppose:
60% of businesses say they collect customer feedback regularly.
But among companies with more than 500 employees:
82%
And among companies with fewer than 50 employees:
39%
Now you have a story.
Or perhaps:
Marketing teams prioritize customer feedback differently from product teams.
Those differences can generate multiple insights.
Create a Clear Research Report Structure
A useful structure is:
Executive Summary
Explain the most important findings.
Methodology
Explain:
-
Number of respondents
-
Audience
-
Collection period
-
Survey method
-
Important limitations
Key Findings
Present the most significant results.
Segment Analysis
Show meaningful differences between groups.
What It Means
Interpret the findings carefully.
Recommendations
Explain practical implications.
Appendix
Provide additional methodology or data where appropriate.
Don't Hide the Methodology
If you want people to trust your research, show them how it was conducted.
State:
We surveyed 1,000 respondents between January 5 and January 20.
Not:
"Our research shows..."
without any explanation.
Transparency is part of credibility.
Turn the Report Into a Content Engine
One research report can generate months of content.
For example:
Research report
↓
10 key findings
↓
10 LinkedIn posts
↓
5 blog articles
↓
3 videos
↓
Infographic
↓
Webinar
↓
Email campaign
↓
Press outreach
↓
Sales presentation
The research becomes the source material.
Use Customer Language
Open-ended responses can be particularly valuable.
Suppose respondents repeatedly describe a problem using the phrase:
"We collect feedback but don't know what to do with it."
That sentence can become a powerful theme throughout the report.
You can use customer language to:
-
Name problems
-
Explain findings
-
Illustrate statistics
-
Create headlines
-
Develop recommendations
Just make sure quotes are used with appropriate permission, anonymity and context.
Use AI to Analyze the Dataset
Large research projects generate a lot of information.
AI can help identify themes in open-ended responses and accelerate analysis.
For example, you might have 2,000 written responses to:
What is your biggest challenge?
AI-assisted analysis can help group responses into themes such as:
-
Low response rates
-
Poor question design
-
Lack of analysis
-
Difficulty acting on feedback
-
Lack of internal ownership
The researcher still needs to validate the analysis.
AI should accelerate the work, not remove methodological judgment.
Enquete Can Support the Entire Workflow
Enquete provides survey creation, multiple question types, custom properties, branching, NPS/CSAT/CES, response filtering, advanced filters, analytics, trend reports, visual reports and AI Insight. It also supports exports including XLSX, CSV, PPTX, DOCX, SPSS and PDF.
That means the platform can support the journey from:
Question
→ Survey
→ Responses
→ Analysis
→ Research findings
→ Report
rather than stopping at data collection.
Your Survey Can Become an Industry Benchmark
Once you repeat the same research periodically, something even more valuable becomes possible.
Suppose you publish:
State of Customer Feedback 2027
Then repeat it in 2028.
Now you can compare:
-
What changed?
-
Which challenges became more common?
-
Which practices declined?
-
Which technologies became more important?
-
How did customer expectations change?
The research becomes a benchmark.
And benchmarks become assets that people have a reason to revisit.
Build Something Worth Referencing
The strongest research reports aren't promotional brochures disguised as surveys.
They answer a genuine question.
They reveal something useful.
They explain how the data was collected.
They acknowledge limitations.
And they give readers something they can use.
That's what makes original research valuable.
Your company doesn't need to publish another article saying:
"Customer feedback is important."
Instead, ask a question nobody has answered recently.
Collect the data.
Analyze it carefully.
Publish what you found.
Then let the research speak for your expertise.
From Survey Tool to Intelligence Infrastructure
A survey doesn't have to be the final destination.
It can be the beginning of a much larger process:
Ask
↓
Collect
↓
Analyze
↓
Understand
↓
Publish
↓
Influence
↓
Learn again
That's the real opportunity behind customer research.
And when you consistently turn customer responses into useful knowledge, your surveys stop being simple forms.
They become a source of original intelligence for your business.
The Customer Intelligence Series
- Why AI Makes Customer Feedback More Valuable, Not Less
- Stop Asking AI What Your Customers Want. Ask Your Customers.
- How to Build a Customer Learning Loop
- What Your Customers Do Isn't the Same as Why They Do It
- How to Turn Survey Responses Into Marketing Intelligence
- How Original Customer Research Can Make Your Brand More Visible in AI Search
- How to Use Customer Feedback to Improve Website Conversion
- How to Combine Behavioral Data With Customer Feedback
- Why More Marketing Data Doesn't Always Mean Better Decisions
- How to Turn Customer Surveys Into Original Research Reports